How to do sieve analysis testing?
Wednesday February-12 2025 10:10:06
This article is only explained through the conventional dry sieving sample analysis method, and the specific sample analysis and test methods should be strictly followed by industry standards!
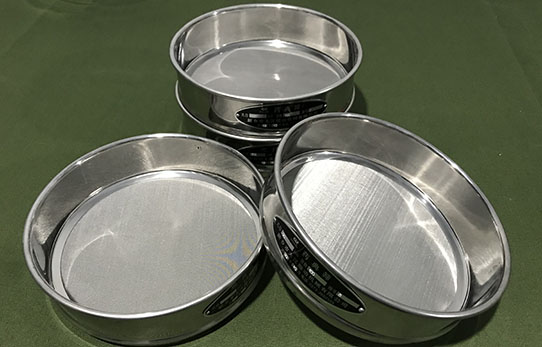
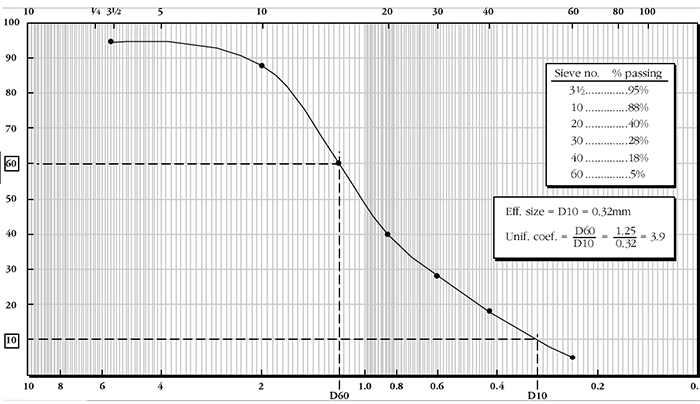
Analytical Test Sieves usage: No. 1-8 sieves (full set of sieves)
Analytical Test Sieves Diameter: 200mm
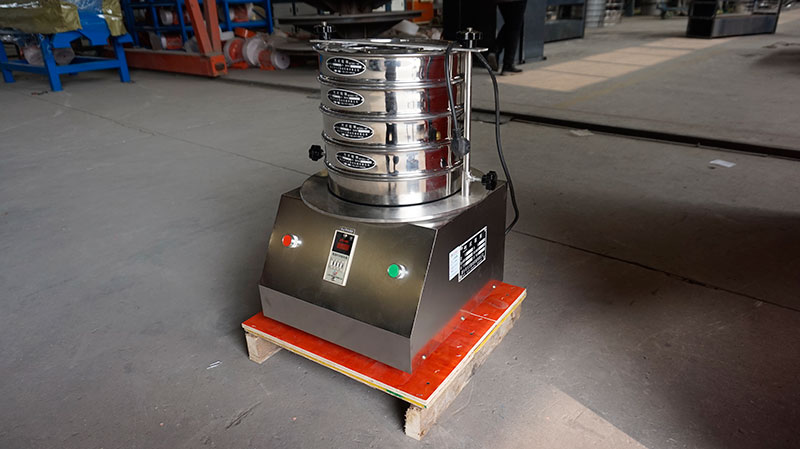
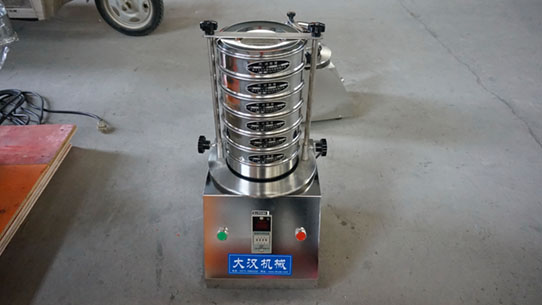
Experimental sieve machine: standard laboratory sieve machine (0-99min timing)
Sample used: Soil
Why is sieve analysis test important?
1. Determine the gradation of aggregates: ensure that the particle size distribution of aggregates meets the design requirements.
2. Control the density of concrete: reasonable aggregate grading can improve the density of concrete and reduce porosity.
3. Improve the strength of concrete: high-density concrete has higher strength and durability.
4. Reduce costs: by optimizing the aggregate ratio, material waste can be reduced and costs can be reduced.
In addition, sieving analysis can also help us identify and remove aggregates with irregular shapes and high mud content, thereby improving the quality of concrete.
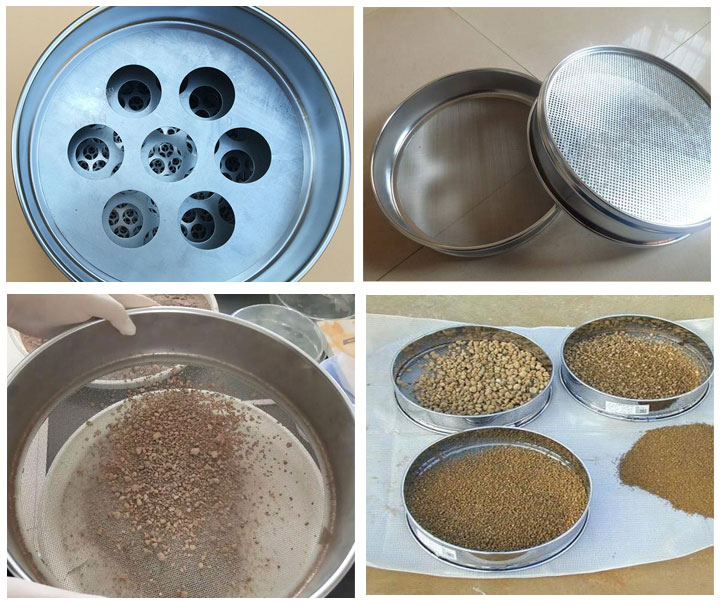
How do you perform a sieve analysis test?
Clean the Analytical Test Sieves before sample analysis to ensure that the sieve surface is free from impurities, clogging and damage.
What are the steps in the sieve analysis test?
Weigh a representative sample, and take about 500g of sample to set as the total sample (or according to the industry standard).
| SI | Maximum size of material present in substantial quantities | Weight to be taken for test in Kgs |
| 1 | 75mm | 60Kg |
| 2 | 40mm | 25Kg |
| 3 | 25mm | 13Kg |
| 4 | 19mm | 6.5Kg |
| 5 | 12.5mm | 3.5Kg |
| 6 | 10mm | 1.5Kg |
| 7 | 6.5mm | 0.75Kg |
| 8 | 4.75mm | 0.4Kg |
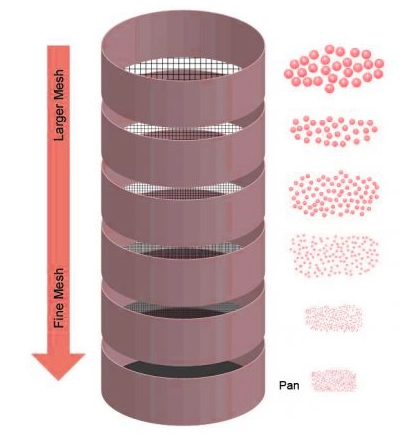
Stack the sieves according to the aperture size of the Analytical Test Sieves. The sieve with a large opening (small aperture value) is placed above the small opening (large aperture value), and the bottom end prevents the tray from collecting samples passing through all apertures. #4 and #200 sieves should always be included in the analysis of samples.
Put the weighed 500g sample into the top sieve of Analytical Test Sieves, place it on the laboratory vibrating sieve (the sample together with all the Analytical Test Sieves stacked together), fix the sieve frame, set the analysis time, and start the machine.
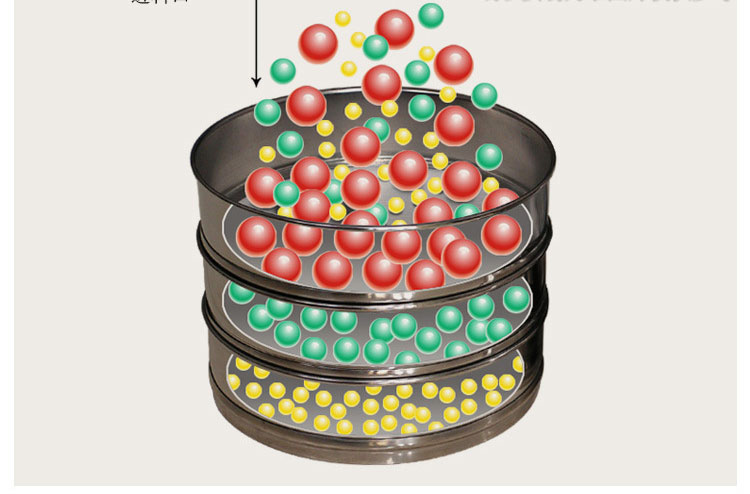
After the machine stops running, the sieve frames are taken out one by one and the weight of the sample retained in each sieve frame is weighed.
Sample retention, data recording, and analysis are performed to derive particle size distribution curves.
If you need to perform comparative analysis of different samples, please keep weighing, use the same model of Analytical Test Sieves, and use the same analysis time (control variable) to conduct sample analysis and comparison.
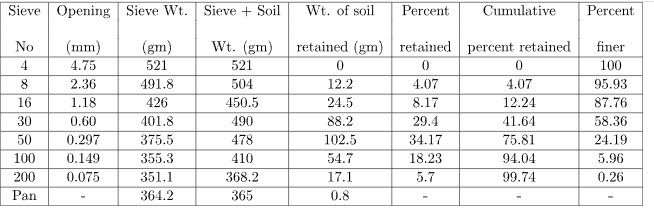
How to do sieve analysis calculations?
The particle size distribution of a soil sample can be obtained by plotting the finer percentage with the corresponding sieve on semi-logarithmic graph paper as shown below.
Once the sieving process is complete, the results need to be calculated and interpreted. The mass of particles retained on each sieve is determined by dividing the mass retained on each sieve by the total mass of the soil sample retained and then multiplying by 100 to find the percentage retained on each sieve. To better understand the distribution of particle sizes, it is useful to calculate the cumulative percentage retained for the soil sample.
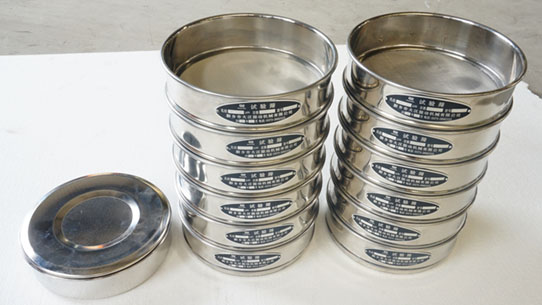
Sieve analysis test sample report
Typically, this is done by weighing the material remaining on each sieve in the pile. This should equal the weight of a representative sample. It is also possible to look at the percentage of material that has passed through. For example, determine the amount of material that has passed through the top sieve, record it, and then do the same for the material that has passed through the second sieve. Continue this process until you reach the lower part of the pile of sieves.
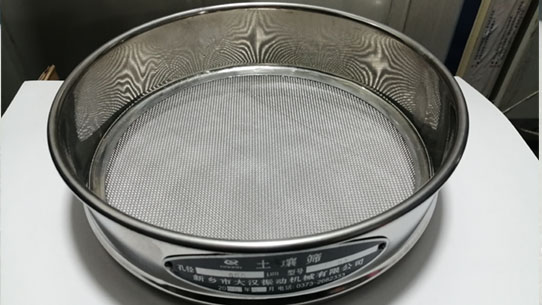 laboratory test sieve